- Invoca
- Support
- Troubleshooting
- Integration troubleshooting guide: is my integrati...
- Subscribe to RSS Feed
- Mark as New
- Mark as Read
- Bookmark
- Subscribe
- Printer Friendly Page
- Report Inappropriate Content
- Subscribe to RSS Feed
- Mark as New
- Mark as Read
- Bookmark
- Subscribe
- Printer Friendly Page
- Report Inappropriate Content
04-18-2019 10:28 AM - edited 07-22-2022 09:54 AM
Once you’ve installed one of our Invoca integrations, we want you to have full confidence that it’s working as intended. With any integration that passes data back and forth between your different apps, errors are certainly possible. This article will help you identify exactly what data your Invoca webhooks are sending to other systems, so you can confirm whether your integrations are working correctly — or diagnose any potential errors.
- Identifying your integration's health using the webhook deliveries chart and delivery history
- If your webhook isn't firing when you expect it to...
- If your webhook's success rate is zero...
- If your webhook succeeds some of the time, but you want to improve it...
- Consulting more detailed records in your Transactions Report....
This article is useful for troubleshooting any of your Certified or Custom Invoca Integrations powered by custom webhooks. To troubleshoot any of the following integrations, which we call "Connect Apps", see below for a unique troubleshooting guide for that integration:
First, let's take a look at your webhook deliveries chart and delivery history
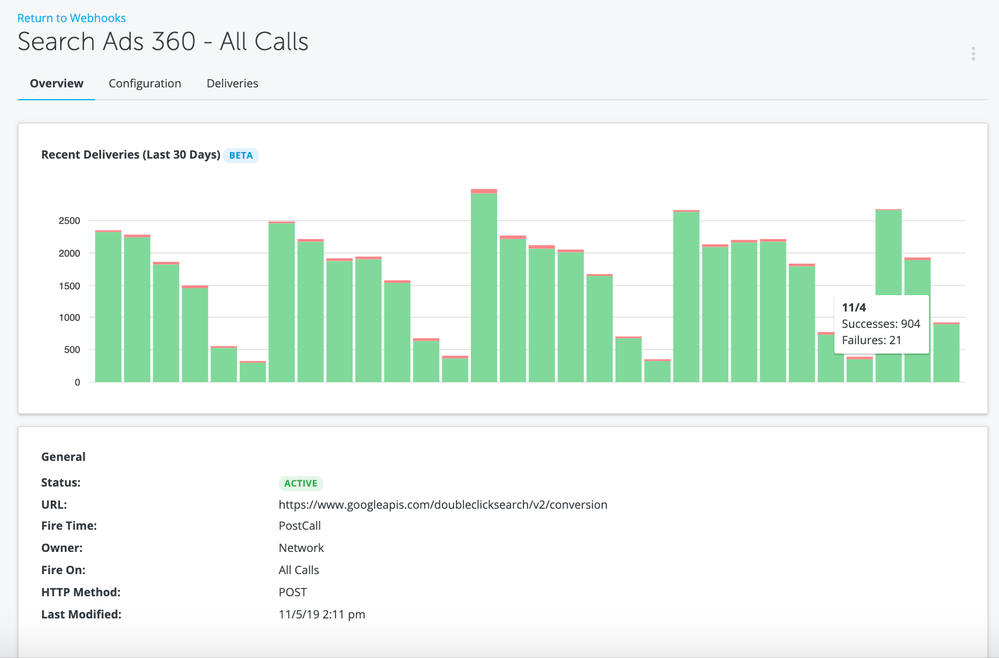
The webhook deliveries chart is a visual representation of each instance a webhook fired. It is a stacked bar chart where the green indicates the end system received the data and returned a success response and the red indicates the end system returned an error response. You should use the chart to understand fluctuations in:
- The volume of data shared.
If you typically see a certain number of deliveries in a given day and see a big drop off or an unexpected jump, that may be something to investigate further. - The number of errors.
If you see more red than green, that's usually not good.
Here's how to access your webhook deliveries chart:
- Log in to your Invoca account. In the gray menu ribbon, hover over Integrations, then select Custom Webhooks.
- Select the webhook that corresponds to the integration you'd like to troubleshoot. If you've been following our Best practices for configuring and managing your integrations, this should be named after your integration.
- That will land you at the Overview tab. At the top of the tab, you'll find the webhook deliveries chart.

There are a few important points to keep in mind as you reference the webhook deliveries chart.
- Data is shown for the last 30 days, includes "today".
- The chart is a stacked bar chart and shows every time the webhook fired each day. Successful webhook fires are in green and errors are in red.
- Hover over the bars to get a count of successes vs. errors.
- If the webhook firing conditions are configured to "retry", it is important to understand that the chart shows all webhook fires, even those that will retry. This means that, at least for webhooks configured to retry, seeing some errors may not necessarily indicate an issue. For example, Search Ads 360 typically requires at least 30 minutes before a conversion can be reported against a click. It is possible Invoca will attempt to report a floodlight activity to Search Ads 360 and Search Ads 360 will return an error because the click is too recent. In this case, we will retry and it's possible a subsequent attempt will see a success response.
If you find you need to troubleshoot further, you can dig into more delivery details in the Delivery History tab.
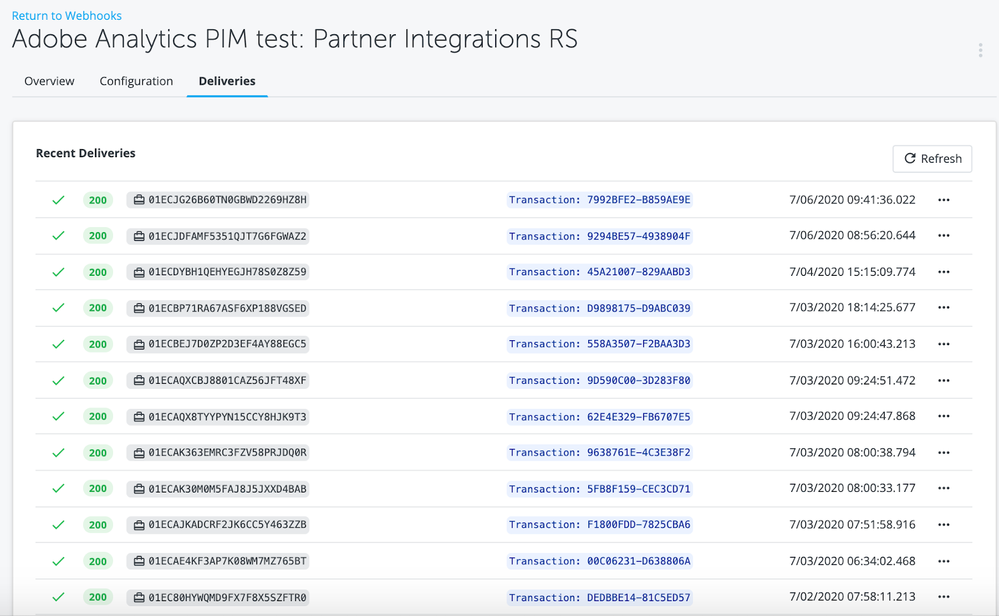
Your webhook delivery history is a tool in your Invoca account that presents an audit of the recent 100 instances when one of your webhooks fired — along with what data it contained, and whether it was received successfully. This makes it a great first step for troubleshooting your integrations.
Here's how to access your webhook delivery history:
- From the webhook Overview page, click the Deliveries tab. Here you'll see a recent history of each time this webhook "fired", or sent data to another system, along with the HTTP status code that your other system returned in response to this transmission.
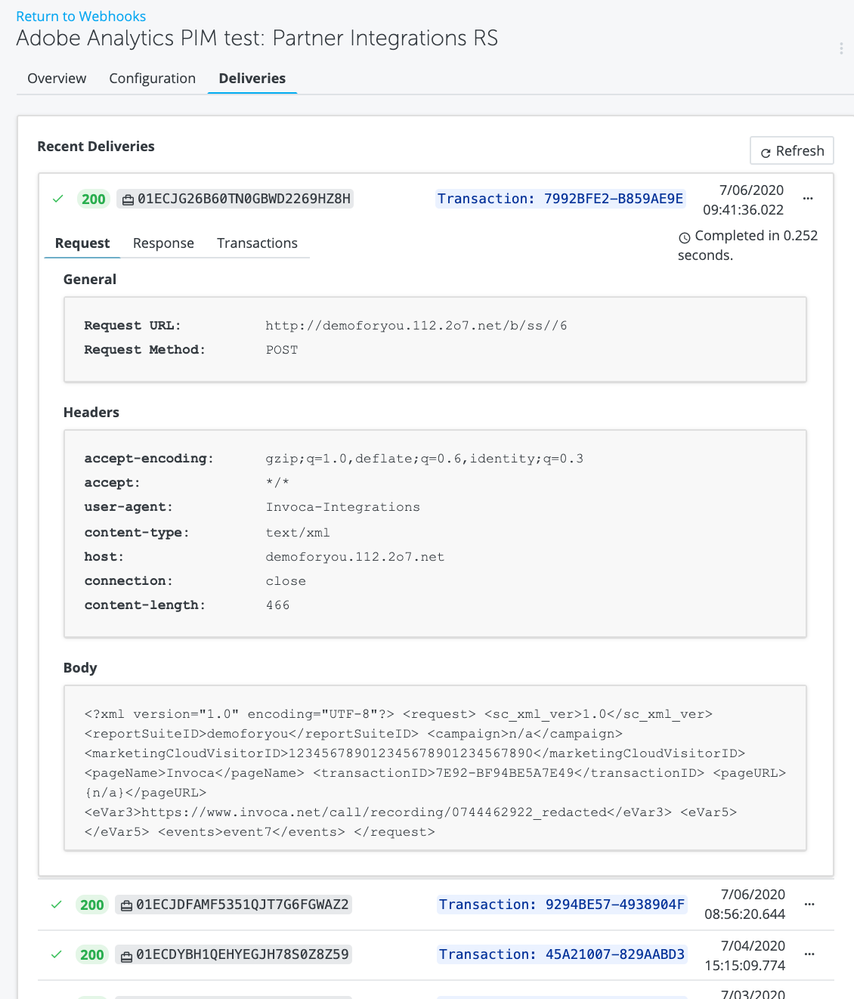
- To view more details about a specific transmission, click to expand the row. You'll see all the data that was sent in the Request sub-tab. You'll see if the end system replied with a success message or error in the Response sub-tab.
Here are a few things you can use your webhook delivery history to troubleshoot:
- You can get a quick understanding of the success rate of your webhook by referencing the status code for recent deliveries. Ideally, most (if not all) deliveries will show a number in the 200s with a green check mark, indicating the delivery was successfully sent.
- You need to double-check all parameter values are captured and sent in the correct format to confirm the webhook is built as you expected, and as instructed by our integration setup guide. Simply click on a specific delivery and the row will expand to show more information. You’ll be able to see the exact endpoint URL, header, body, and values delivered to the end solution in the Request tab.
- Homing in on specific deliveries that received a status code that indicates an error (usually something in the 400s or 500s), you can often get more information about the issue by expanding the row and clicking the Response tab. Many solutions will provide a more detailed message associated with the status code to help you diagnose what went wrong.
If your webhook isn't firing when you expect it to, let's check your Invoca settings
If you don't see any recent deliveries in your webhook stats or delivery history, and you expected to see some deliveries within that time frame, the problem likely lies with your Invoca configuration. Here are a few things you can check to address the problem:
- Make sure your Invoca Tag is correctly deployed and is tracking your phone calls.
- Look at the Firing Conditions configured for your webhook.
- Is your webhook configured at the correct account level level? Webhooks you create at the Profile level will only trigger for calls received through that Profile, while webhooks created at the Network level will check all calls received in your Invoca account. See Platform Organization and Account Types to learn more about Invoca account level controls.
- Similarly, check to see if you have a Profile or Campaign filter set in the Firing Conditions.
- If your webhook is set to fire on a signal (see How to create, edit, or clone an Invoca webhook), check your Invoca Calls Report and make sure your calls are being correctly tagged with that Signal. If they aren't, try editing your Signal settings or webhook firing conditions.
If your webhook is firing, but your deliveries are not received successfully, try troubleshooting your HTTP status codes
As we mentioned above, your webhook delivery history shows the HTTP status code for each of your recent webhook transmissions. These can be helpful to figure out issues with the data being sent or formatting errors, especially if all of your webhook deliveries show a status code that indicates an error.
Expand a few delivery rows to view the Response tab. The Response is what is returned by the end solution to provide more information about the error. This is a great place to start, but if it isn’t quite enough information to understand how to fix the issue, it can be very helpful to take the message in the Response and search the web for more information. Popular technical forums, like Stack Overflow (external link), or the end solution’s API documentation often have more details about how to go about fixing common issues.
When reading response codes, keep in mind that some solutions, like Google Campaign Manager, can return a 200 success status code even when the webhook wasn't actually properly received. In these cases, check the webhook response for a message relaying an error in processing the API request (for example, encrypted user ID is missing, etc.).
If the Response is not verbose enough to fully understand the issue, here are a few potential solutions you can try depending on your status code:
- Is the webhook set up to send to the correct integrated account?
- Is the user who authenticated/authorized your integration have the appropriate user permissions of the integrated system to set up an integration (for example, an administrator role)?
- Does your integration require an OAuth token, login credentials, or another form of authentication?
- Have you correctly set up your integrated system app to receive Invoca data? For example, have you set up an event/goal/floodlight in your other app to be filled with Invoca data?
- Do the webhook headers and parameters correctly match up with the field names you're transmitting on either side? Pay special attention to letter case, spaces, and special characters.
If your webhook is firing, but data is not showing up in the end solution or there are discrepancies
Invoca integrations often work by sending a record of a call or signal that occurred in your Invoca platform to another system, where it's matched with an independent record in that other system. It’s important to distinguish between (a) successfully sending data and (b) processing the data to determine if it should be attributed or actually show up in that end system.
It is possible that Invoca successfully delivered data, but the end solution could not attribute the event or conversion in their system based on the data provided or rules set in their system. Even in a successful integration setup, we expect those records to match up less than 100% of the time — sometimes significantly so, depending on the integration.
If your webhook successfully sends data, but you want to understand why some or all information is not showing up in the end system, you might consider trying the following:
- Be aware of the conditions the end system requires to process or attribute data. For example, Adobe Advertising Cloud will only process action types if either the Marketing Cloud Visitor ID or the ef_id is present. Similarly, Google Campaign Manager will only attribute data if a gclid or encrypted user ID is present. If a webhook is delivered successfully, but doesn’t have the required parameter values, then it will not show up in the end solution.
- If a required value is missing, check your dynamic promo number swapping and overflow call settings (see Basic Knowledge: RingPools). You may not be collecting as much unique attribution on your Invoca phone calls as you're expecting, which can cause discrepancies in your records between Invoca and other systems.
- In addition to understanding the parameter values required to match an Invoca event or data point, you should be mindful of settings in the end system. Examples include unique conversion count settings (i.e. counting one per click or all), attribution windows, or attribution models (first touch vs. last touch), to name a few.
- This can often be a source of discrepancy between Invoca and the end system. It might help to do a quick audit of your Marketing Data attribution rules in Invoca and the conversion attribution rules in the end system.
- Occasionally, end systems report attributed events or conversions based on the date of the initial impression or click vs. the date of the conversion.
- Numbers might line up more closely if you take this into account, where appropriate, and change the filters of your report in the end system. As an example, in your Transactions Details Report, Invoca reports Signals based on the time the Signal was processed. Google Ads, on the other hand, will report conversions based on the date of the ad impression. If there is some delay between the call and the Signal, then you’ll need to account for that as you run reports in both systems.
Need a more detailed count of your Invoca records? Run a Transaction Details report with some well-chosen filters
As mentioned above, the best way to get a granular view of the data eligible to be sent to another system is to run a Transactions Details Report for the date range and then filter for the different conditions that must have been met. If you are checking to see if your Signals have been transferred, double check that you have included the Signal Value column and filter for True.
Still need help? Get in touch with our friendly support team!
If this guide didn't do the trick, our Customer Success team will be happy to look at your problem. You can click the “Contact Support” button at the bottom of this article to create a new ticket and get in touch right away.
Related:
• Best practices for configuring and managing your integrations
• Using your Invoca reports
• Viewing Marketing Data in your Invoca reports


