This website uses cookies. By clicking Accept, you consent to the use of cookies. Click Here to learn more about how we use cookies.
Turn on suggestions
Auto-suggest helps you quickly narrow down your search results by suggesting possible matches as you type.
4749members
1486posts
50online
- Invoca
- Product Documentation
- Reporting
- Invoca Reporting Suite
- Viewing Marketing Data and Signals in your Invoca ...
Options
- Subscribe to RSS Feed
- Mark as New
- Mark as Read
- Bookmark
- Subscribe
- Printer Friendly Page
- Report Inappropriate Content
This is a verified product documentation article. For case-based resolutions articles, please reference the Knowledge Base section of Invoca Community.
Employee
Options
- Subscribe to RSS Feed
- Mark as New
- Mark as Read
- Bookmark
- Subscribe
- Printer Friendly Page
- Report Inappropriate Content
on
03-06-2019
06:00 PM
- edited on
02-05-2025
04:21 PM
by
![]() Jacaselon
Jacaselon
Once your Invoca account has been set up to capture Marketing Data and Signal insights from your phone calls, you can view that information using your Invoca reports. Specifically, you can use the following reports for different lenses on your Invoca data:
- Your Calls Report lists every phone call in your Invoca account one-by-one, along with its associated value for each Marketing Data field, including Signals, in your Invoca account.
- Your Transactions Report lists each event in your Invoca account that would update your Marketing Data values, including new phone calls as well as post-call insights and corrections.
- Your Custom Summary Report shows your Marketing Data in aggregate across your phone calls, pivoting on your Marketing Data categories, short text fields, or standard Invoca call data fields.
Your Calls by Hour and Calls by Day of Week reports aggregate your Marketing Data by when your calls occurred for easy comparative analysis.
To access your Invoca reports, log in to your Invoca account and click Reports in the gray menu ribbon. Then, select the report you’d like to view. For general information about sorting and filtering the data in your Invoca reports, check out Using your Invoca reports. Now, let’s go into each of these reports one-by-one for a more detailed look at how view your Marketing Data.
Viewing the Marketing Data values for each phone call using your Calls Report
When you access your Calls report, you’ll notice that each row in your report represents a phone call received by Invoca. The columns in your Calls report each represent a piece of information about that phone call, including the values for each Marketing Data field and Signal in your Invoca account for that phone call.
If you don’t see the Marketing Data field or Signal you’re looking for, click Edit Columns and select the checkbox for that field. When you’re finished, click Done. The fields you’ve selected will now appear as columns in your report.
You can also filter which calls appear in your Calls report based on the value for that call in your Marketing Data categories or short text fields. To do so, click the blue “+” button in the Filters section of your call report. In the menu that pops up, select one of your Marketing Data fields, then the value for that field that you want to see. When you’re finished, click Save.

Example:
In the above screenshot, the Calls report is filtered to only show calls in which the caller’s Website Location (a Custom Data category) was not captured. In each of these calls, the signals for “Sales Call” and “sale” reported as false, and no data was captured for the “Medium or “Source” Marketing Data fields. In the third and fourth calls in the report, the signal “test signal2” reported as true.
In the above screenshot, the Calls report is filtered to only show calls in which the caller’s Website Location (a Custom Data category) was not captured. In each of these calls, the signals for “Sales Call” and “sale” reported as false, and no data was captured for the “Medium or “Source” Marketing Data fields. In the third and fourth calls in the report, the signal “test signal2” reported as true.
Viewing each Marketing Data and Signal update event using your Transactions Report
Similar to your Calls Report, your Transactions Report shows the Marketing Data and Signal values for each phone call as it enters your Invoca account. However, instead of each row representing a different phone call, the rows in your Transactions report represent the events that update the Marketing Data and/or Signal values in one of your phone calls. These updates can come from either a new phone call or a post-call event — which include corrections to your data, as well as data imported using Signal file upload, Marketing Data file upload, and Signal API integrations. This makes the Transactions Report useful for tracking and troubleshooting the flow of data in your account.
The different types of events that create rows in your Transactions report vary depending on the date range you are looking at:
- If analyzing data after 11/12/2019, each row in your Transactions Report will represent an event that updated. In this newer version, events that update more than one Signal or Marketing Data value are combined together into a single row in your report.
- If analyzing data before 11/12/2019, you will also see a separate row in your Transactions Report for each of your Signals as it is applied to each phone call.


The columns in your Transactions report each represent a piece of data that was updated in your transaction event, such as the values your Marketing Data fields. If you don’t see the Marketing Data field or Signal you’re looking for, click Edit Columns and select the checkbox for that field. When you’re finished, click Done. The fields you’ve selected will now appear as columns in your report.
You can also filter which calls appear in your Transactions report based on the value for that call in your Custom Data categories or short text fields. To do so, click the blue “+” button in the Filters section of your call report. In the menu that pops up, select one of your Marketing Data fileds, then the value for that field that you want to see. When you’re finished, click Save.
Viewing your Marketing Data and Signal values in aggregate with your Custom Summary Report
When you open your Custom Summary report, first click the blue “+” button in the Categories section. You’ll notice a list of each category or short text Marketing Data field you’ve created in your Invoca account. Select the data you’d like to view, then click Save. Each row in your Custom Summary report groups your phone calls by each different value for that field.
The columns in your Custom Summary report show data from your phone calls, including your Signals. Since the rows represent groups of calls instead if individual calls, your Signal columns will show the percentage of those calls that fulfilled that Signal. If you don’t see the Signal you’re looking for, click Edit Columns and select the checkbox for that field. When you’re finished, click Done. The fields you’ve selected will now appear as columns in your report.
You can also filter which calls appear in your Transactions report based on your Signals. To do so, click the blue “+” button in the Filters section of your call report. In the menu that pops up, select one of your Signals, then the value for that Signal (true or false) that you want to see. When you’re finished, click Save.

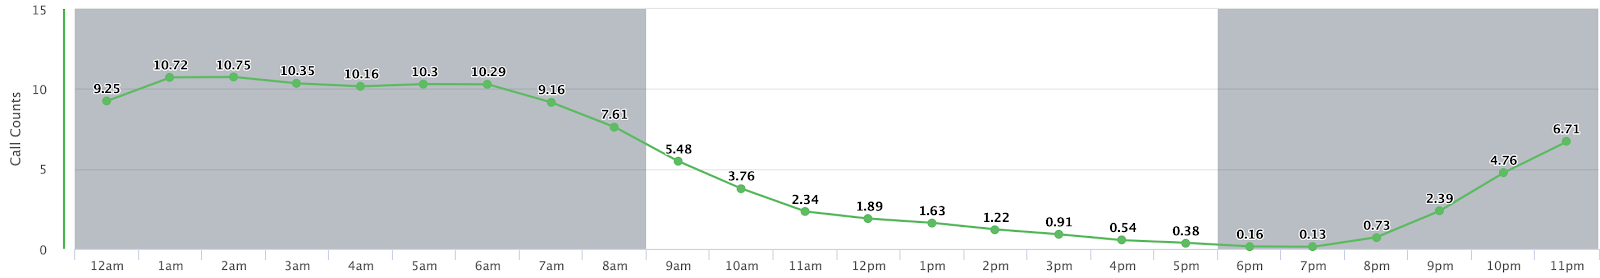
Viewing your Marketing Data for all calls occurring in a given timeframe using your Calls by Hour and Calls by Day of Week reports
Similar to your Custom Summary report, your Calls by Hour and Calls by Day of Week reports aggregate your phone calls together so you can view trends in your Marketing Data. In this case, these reports help you analyze your calls by when they occur. Use the same directions as the Custom Summary reports, above, to select which Marketing Data fields you’d like to analyze in your Calls by Hour or Calls by Day of Week reports, or filter your calls based on your Signals.
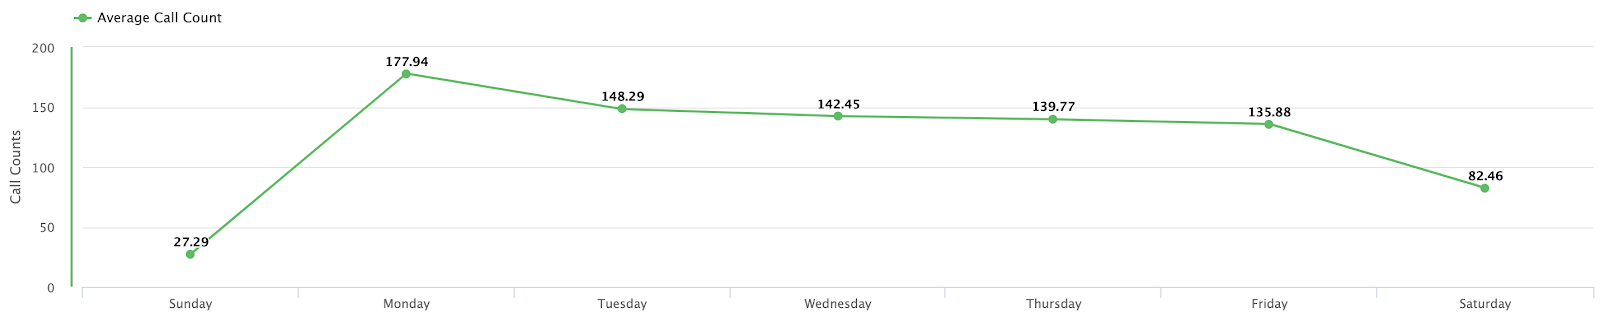
The rows in these reports will list the Custom Data categories or short text fields that you choose to analyze, and the columns will show aggregated data for each time frame in your report. You can customize the columns included in your Calls by Hour report — by default, your Calls by Hour report will show calls fielded from 8 a.m. to 5 p.m., but this can be filtered for any time range. Your Calls by Day of Week report, on the other hand, will always show all calls from Sunday through Saturday.
Additional examples
Here are a few examples of how the same information from your Invoca account might appear in your various Invoca Reports. We’ve also included how these reports might look different based on what version of the Transactions API and Transactions Report are included in your Invoca account.
File upload CSV:
| transaction_id | partner_unique_id | occurred_at_time | revenue | Signal A | Signal B |
| 111111-111111 | abc | 2019/02/04 13:00 PM | 100.00 | True | True |
In this example, we’re using File Upload to report two Signals, “Signal A” and “Signal B”, on a phone call with the transaction ID “111111-111111”. Here’s how that call looks in newer versions of your Invoca reports, with your Signal data for each call combined together:
Calls Report (new version)
| call_start_time | transactions | revenue | Signal A | Signal B |
| 2019/02/03 | 2 | 100.00 | True | True |
Transaction Detail Report (new version)
| transaction_id | tx_type | partner_uniq_id | occurred_at_time | revenue | Signal A | Signal B |
| 111111-111111 | Call | |||||
| 111111-22222 | Post Call Event | abc | 2019/02/04 13:00 PM | 100.00 | True | True |
Here’s how that phone call looks in an older version of your Invoca reports, with each Signal reported in its own row:
Calls Report (old version)
| call_start_time | transactions | revenue | Signal A | Signal B |
| 2019/02/03 | 3 | 200.00 | True | True |
Transaction Detail Report (old version)
| transaction_id | tx_type | partner_uniq_id | occurred_at_time | revenue | Signal A | Signal B |
| 111111-111111 | Call | |||||
| 111111-22222 | Signal | abc | 2019/02/04 13:00 PM | 100.00 | True | |
| 111111-33333 | Signal | abc | 2019/02/04 13:00 PM | 100.00 | True |
